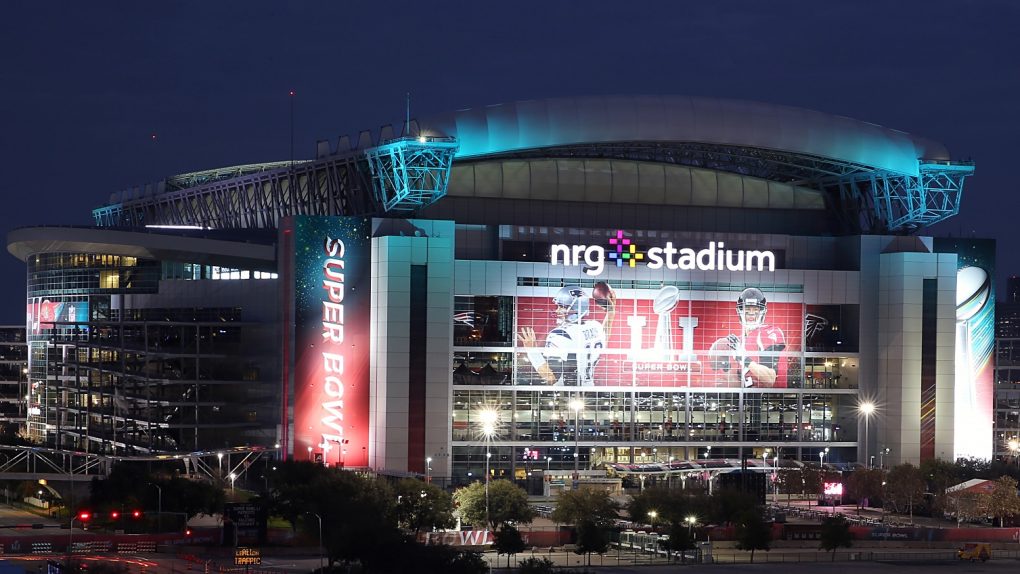
While last night was a big occasion for a few football teams and Philadelphia’s entire police department, it was also the stage for a high-profile showdown between the wireless networks over whose network would perform the best. A Super Bowl is a unique event that stress-tests the network inside a stadium like nothing else; tens of terabytes of data get transferred in the space of a couple hours, with tens of thousands of wireless devices competing within a small space for limited network resources.
All four wireless providers poured years of prep and millions of dollars into improving the network in the US Bank stadium prior to the big game, so naturally, all the carriers want to claim their network was best. T-Mobile was the first to jump on the press releases this morning, pointing to crowd-sourced data from the Speedtest app that showed its network on top. But according to Verizon, that data is “easily manipulated,” and other studies paint a very different picture.
T-Mobile customers “won big at last night’s Super Bowl,” T-Mobile CTO Neville Ray said in a blog post accompanying the Speedtest data. According to the chart T-Mobile provided, the average 4G LTE speed for its customers was 121Mbps, compared to 54.89Mbps for Verizon and 60Mbps for AT&T.
However, T-Mobile’s average speed claim is based on tests from just 24 devices, and Verizon’s VP of network support Mike Haberman suggested that the small sample size means the results aren’t trustworthy. “So few individual users use [the Speedtest app] that the data’s meaningless, you can influence the numbers. The reality is, your competitors can take devices to the bathroom and run tests on it to lower throughput. That’s why we don’t rely on the data, as it can be very easily manipulated.” A T-Mobile spokesperson said that the company did not make an attempt to manipulate the data.
Instead, Verizon pointed to data from P3, an engineering firm that Verizon hired to conduct walk tests throughout the entire stadium with four iPhone 8s, one on each network, conducting a total of 350 unique tests. That data showed Verizon on top, with an average speed of 61Mbps, and T-Mobile in third place with 40Mbps. AT&T was in second with 56.9Mbps.
Those results also agree with data published by Tutela, a firm that partners with third-party applications to anonymously collect millions of speed tests in the background while users are using certain apps. Tutela’s data was collected from in and around the stadium, rather than only inside the stadium, and it puts Verizon in first place with average speeds of around 30Mbps. The other three carriers fought for second place throughout the week before the game, with speeds hovering between 10 and 15Mbps.
Ookla stood by the results from its Speedtest app, with a spokesperson saying that Speedtest controls for “outliers” to ensure the validity of its results, and that Ookla “does extensive work to protect the integrity of our tests, and every sample that we analyse, we stand behind the integrity of that being a real-world, consumer-initiated test.”
Different testing methodologies frequently reveal different results for network speed tests, and the disparity between results is what we’ve come to expect. T-Mobile routinely tops crowd-sourced data from Ookla and OpenSignal, while Verizon has swept opinion panels like JD Power and drive tests like Rootmetrics for years.


