
- An analysis of the coronavirus figures so far indicate that the US is about to face a massive third wave of COVID-19 infections that could peak even higher than the first two.
- Statistical data shows that the second wave hit the US in early June, as the nation failed to flatten the curve like other countries did.
- The second wave saw a considerable drop in cases by mid-July after daily new cases had climbed to terrifying highs that eclipsed the first wave.
- Now, the numbers are going up again.
Defying expectations that the warmer weather would reduce the risk of COVID-19 transmission, the novel coronavirus spread like wildfire during the summer months. The fact that SARS-CoV-2 can survive warmer temperatures wasn’t a surprise, given that regions with warmer climates experienced a first COVID-19 wave just like other countries at the beginning of the year. But other parts of the world managed to get the spread under control. European countries flattened the curve significantly just as America battled a second wave that was even bigger than the first. By all accounts, the US as a whole never flattened the curve, although some states were able to tame the virus.
Health experts like Dr. Anthony Fauci have been warning all summer long that the coronavirus infection rate has to come down significantly before the colder seasons arrive. Fall and winter usually bring back flu epidemics and health officials are worried that the coronavirus-flu convergence would make it even more difficult for healthcare workers to do their jobs. Now, new data suggests that the coronavirus catastrophe we’ve all been dreading might indeed be unstoppable.
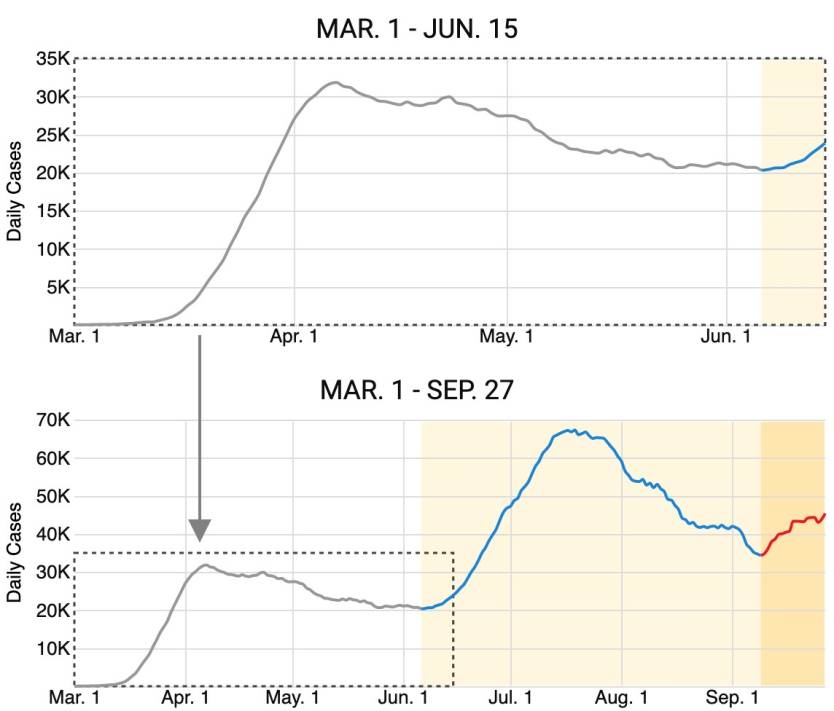
Compiling information from the Johns Hopkins Center for Systems Science and Engineering, Time points to some imminent deja-vu. The US seemed to be on the right track at reducing the rate of infections nationwide in late May, but then cases skyrocketed in early June. The number of daily cases went up for more than a month, hitting a peak in mid-July, and then the figure started dropping, hitting a low point in mid-September. But that’s when the number of daily infections started going back up again, just like it did in early June. And the new plateau is now even higher, suggesting that the third wave might have an even scarier peak.
The following figures should put things in perspective:
- first wave peak in early April: 32,000 cases per day (nearly 10 cases per 100,000 residents)
- first wave plateau in late May: over 20,000 cases per day
- second wave peak in mid-July: over 67,000 cases per day (more than 20 cases per 100,000 residents
- second wave plateau in mid-September: over 34,000 cases per day
According to recent data, the coronavirus statistics for the US show that the number of cases has been increasing steadily since mid-September, rising to 45,300 a day. The curve is going up again, just as it did in early June, and it’s all happening from a higher baseline. That’s why the next peak is expected to surpass the terrifying figures from mid-July.
The data also indicates that the virus has moved to different states that had not experienced high case numbers until now. The first wave affected the Northeast the most, and the second wave was felt most in southern states and California. There’s now a resurgence in the south and a significant uptick of cases in several states in the Midwest, including Wisconsin, Minnesota, Utah, Wyoming, and the Dakotas.
Time points out that the virus is now impacting smaller counties, compared to the first two waves, where it was the largest counties that were hit the hardest. Data from the same Johns Hopkins analysis shows a significant increase in cases in rural regions or counties that have between 400 and 220,000 residents. A third of the US population lives in these counties.
If the warmer weather combined with the ease of lockdown restrictions favored COVID-19 transmission during the summer, the colder season would push more people indoors. That’s actually where most transmission occurs. Saliva droplets and aerosols that are both invisible to the eye are ejected during coughing, sneezing, talking, or even just breathing. Add to that the flu factor and you may end up with an even worse coronavirus wave this winter that will take months to subside.
The same public health measures that can reduce the spread of COVID-19 still apply, regardless of how warm or cold it is outside. Wearing face masks, washing hands often, and practicing social distancing can reduce the risk of transmission. Time’s article, complete with more graphs from Johns Hopkins, is available at this link and it’s worth a read.


