How To Track Hurricane Lane, Currently Aiming For Hawaii
A rare hurricane watch has been issued for parts of Hawaii as Hurricane Lane, a Category 4 storm, looks increasingly like it might hit some of the islands. On Tuesday morning Pacific Time, the Central Pacific Hurricane Center in Honolulu issued a hurricane watch for the eastern Hawaiian Islands. That includes the Big Island and the islands of Maui, Lanai, Molokai, and Kahoolawe.
The watch says that hurricane conditions may be possible in those areas, and tropical storm-level winds may hit the islands as soon as Wednesday or Thursday. The Hurricane Center said that the watch may be extended to the western islands.
The best resource for tracking Hurricane Lane is the National Hurricane Center, which labels and tracks all storms that come near the US. The Hurricane Center publishes up-to-date forecasts for the storm, including maps of the predicted path, forecasts and written advisories for areas that are going to be hit.

One of the most useful things published by the Hurricane Center is the 5-day forecast cone and coastal watches. The map shows the predicted path of the storm, with the center of the hurricane represented by the black dots, which show the center at different times.
The white cone spread around is not the area that will be impacted by the hurricane; rather, it's the track forecast uncertainty for days 1-3, and the hashed cone area is the uncertainty for days 4-5. The NOAA explains it:
NHC tropical cyclone forecast tracks can be in error. This forecast uncertainty is conveyed by the track forecast "cone", the solid white and stippled white areas in the graphic. The solid white area depicts the track forecast uncertainty for days 1-3 of the forecast, while the stippled area depicts the uncertainty on days 4-5. Historical data indicate that the entire 5-day path of the center of the tropical cyclone will remain within the cone about 60-70% of the time. To form the cone, a set of imaginary circles are placed along the forecast track at the 12, 24, 36, 48, 72, 96, and 120 h positions, where the size of each circle is set so that it encloses 67% of the previous five years official forecast errors. The cone is then formed by smoothly connecting the area swept out by the set of circles.
It is also important to realize that a tropical cyclone is not a point. Their effects can span many hundreds of miles from the center. The area experiencing hurricane force (one-minute average wind speeds of at least 74 mph) and tropical storm force (one-minute average wind speeds of 39-73 mph) winds can extend well beyond the white areas shown enclosing the most likely track area of the center.
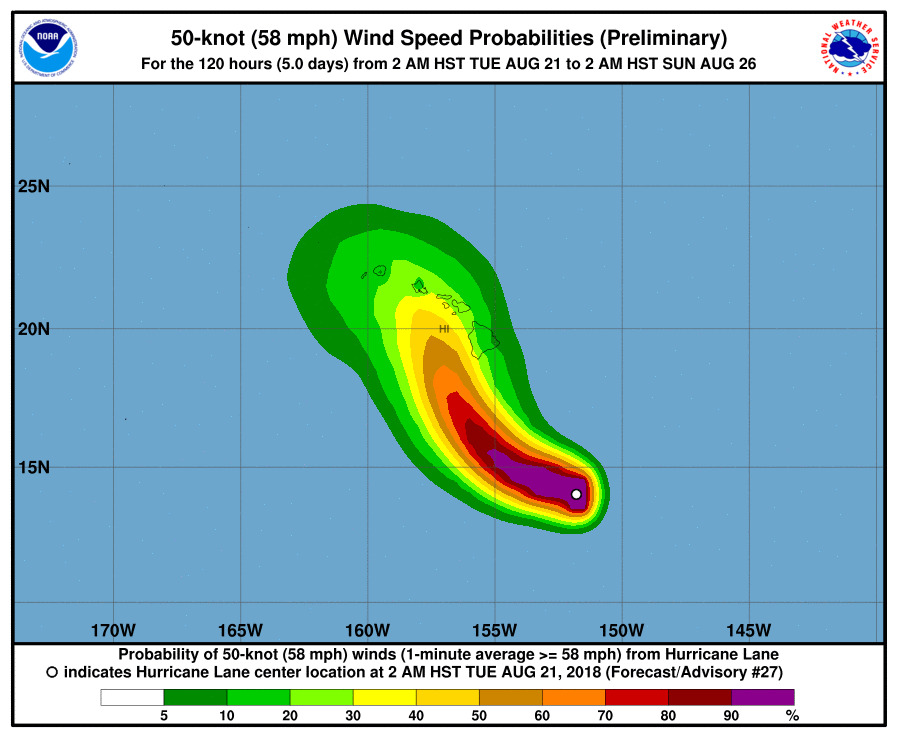
For tracking the effects of the hurricane, rather than just forecasting the center, it's useful to look at the NOAA's wind speed charts. They're published for tropical storm force and hurricane force winds. The charts show the probability that those winds will hit a particular area.
