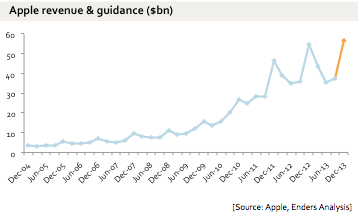
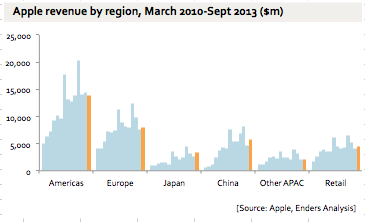
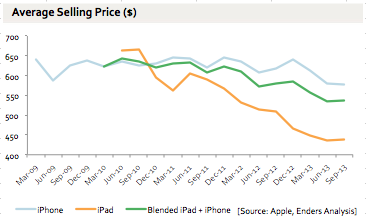
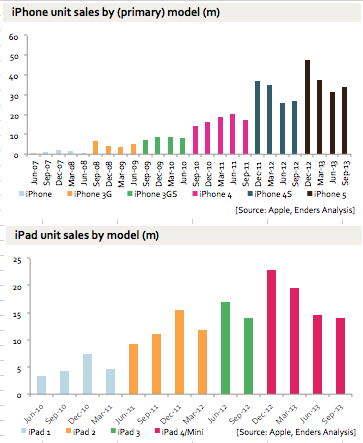
Apple posted its fiscal fourth-quarter results on Monday and Wall Street was not impressed. Apple’s results were strong indeed, however growth is slowing significantly, margins continue to slide and Apple missed FQ4 whisper numbers. Shares have recovered since dipping as much as 4% following Apple’s report though, and Apple was upgraded by a number of high-profile banks on Tuesday morning as analysts continue to look over the picture that Apple’s fiscal fourth quarter numbers paint. Charts are always a terrific way to analyze that picture effectively, of course, and mobile analyst Benedict Evans is one of the best at laying out key Apple data points and helping arrange all the data logically and thoughtfully. A few of Evans’s charts follow below and the rest can be seen in his blog post, which is linked in our source section.
Apple’s Q4 in charts
Updated Dec 19th, 2018 8:43PM EST

If you buy through a BGR link, we may earn an affiliate commission, helping support our expert product labs.
Zach Epstein has been the Executive Editor at BGR for more than 10 years. He manages BGR’s editorial team and ensures that best practices are adhered to. He also oversees the Ecommerce team and directs the daily flow of all content. Zach first joined BGR in 2007 as a Staff Writer covering business, technology, and entertainment.
His work has been quoted by countless top news organizations, and he was recently named one of the world's top 10 “power mobile influencers” by Forbes. Prior to BGR, Zach worked as an executive in marketing and business development with two private telcos.


