Apple products were incredibly popular this holiday season, according to new data tabulated by Flurry. Specifically, the iPhone and iPad accounted for 44% of all new device activations in the week leading up to Christmas. Samsung devices, meanwhile, accounted for 26% of all new device activations.
“Similar to last year,” Flurry noted in a blog post, “44% of new phone and tablet activations were Apple devices. While Samsung dominates global market share, they fell short as the gift of choice during the holiday season, with only 26% of activated devices in the lead up to Christmas. Samsung’s activation rate is up 5% from the 2016 holiday season, which can likely be attributed to the 2017 introduction of the Galaxy S8 after the late 2016 recall of their malfunctioning Note devices.”
The chart below is rather telling. No one comes close to competing with Apple over the holidays:

Even more interesting, though, is a breakdown of iPhone activations across specific models. Apple famously never breaks out sales figures for individual iPhone models, so the data below at least gives us a little bit of a glimpse into how individual iPhone sales stack up. As illustrated below, Flurry’s data suggests that the three most popular iPhone devices this holiday season were the iPhone 7, the iPhone 6, and the iPhone X. Echoing what many analysts are saying, that data also demonstrates that the iPhone X is selling better than any individual iPhone 8 model.
“The prominence of the iPhone 6 is particularly interesting,” Flurry notes, “as Apple only relaunched that model to resellers in select international markets in the spring of 2017. It’s apparent that the consumer concern for cost is still significant, as the iPhone 6 is often marketed as the most affordable option in the regions where it is available.”
That said, it’s worth noting that the data here is only from the week leading up to Christmas. In other words, it may not be the most representative week to draw conclusions from as buyers might tend to be more cost conscious when buying smartphones as gifts than when they’re buying a device for themselves.

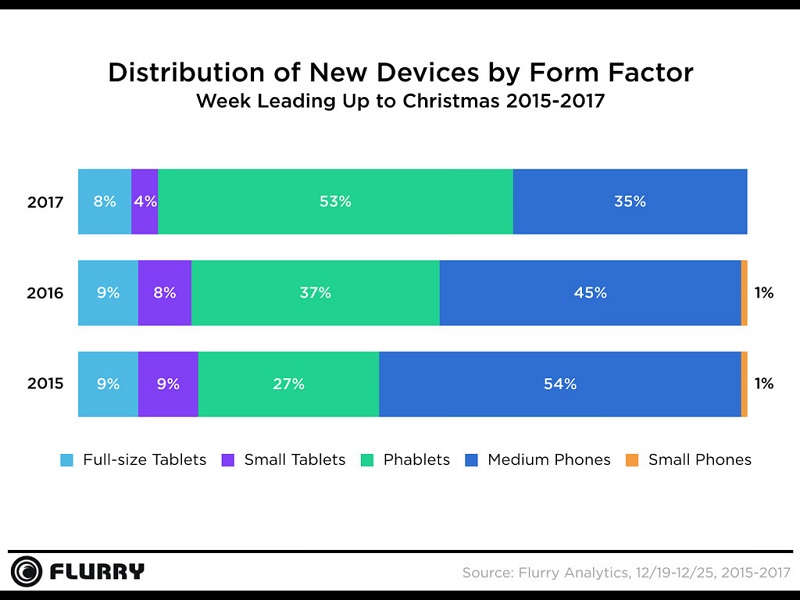
As a final point of interest, the following chart highlights the most popular form factors of smart devices: