Browse 20 Years Of Earth's Weather With NASA's Incredible Worldview Tool
Whenever NASA shows off a stunning new image of Earth from space it's fun to take a few minutes to soak in all the details. What we sometimes forget is that NASA's high-flying tools don't just capture those amazing moments, they capture everything. For almost two decades NASA's Moderate Resolution Imaging Spectroradiometer (MODIS) hardware has been observing weather patterns here on Earth and now, thanks to the magic of the internet, you can journey through it all, day by day, right from your browser.
NASA updated its Worldview application with the incredible wealth of weather data and the tool is a breeze to use. In addition to the update, NASA released a brief video showcasing a few of the highlights hidden in the massive amount of data, showing you when and where to zoom in if you want to check it out for yourself.
"In the '80s and '90s, if you wanted to look at, say, clouds off the coast of California, you had to figure out the time of year when it was best to look at these clouds, then place a data request for a specific window of days when you thought the satellite overflew the area," Santiago Gassó of NASA's Goddard Earth Sciences Technology And Research program, explains. "You would get a physical tape with these images and have to put this into the processing system. Only then would you know if the image was usable. This process used to take from days to weeks. Now, you can look at images for days, weeks and even years in a matter of minutes in Worldview, immediately find the images you need, and download them for use. It's fantastic!"
"Fantastic" is a great way to describe the tool, and it's actually way more fun to browse through days, months, and years of weather patterns than you might imagine. A particularly neat addition to the tool is the ability to select a date range and then click the little video icon to run an animation showing the movement of the weather systems.
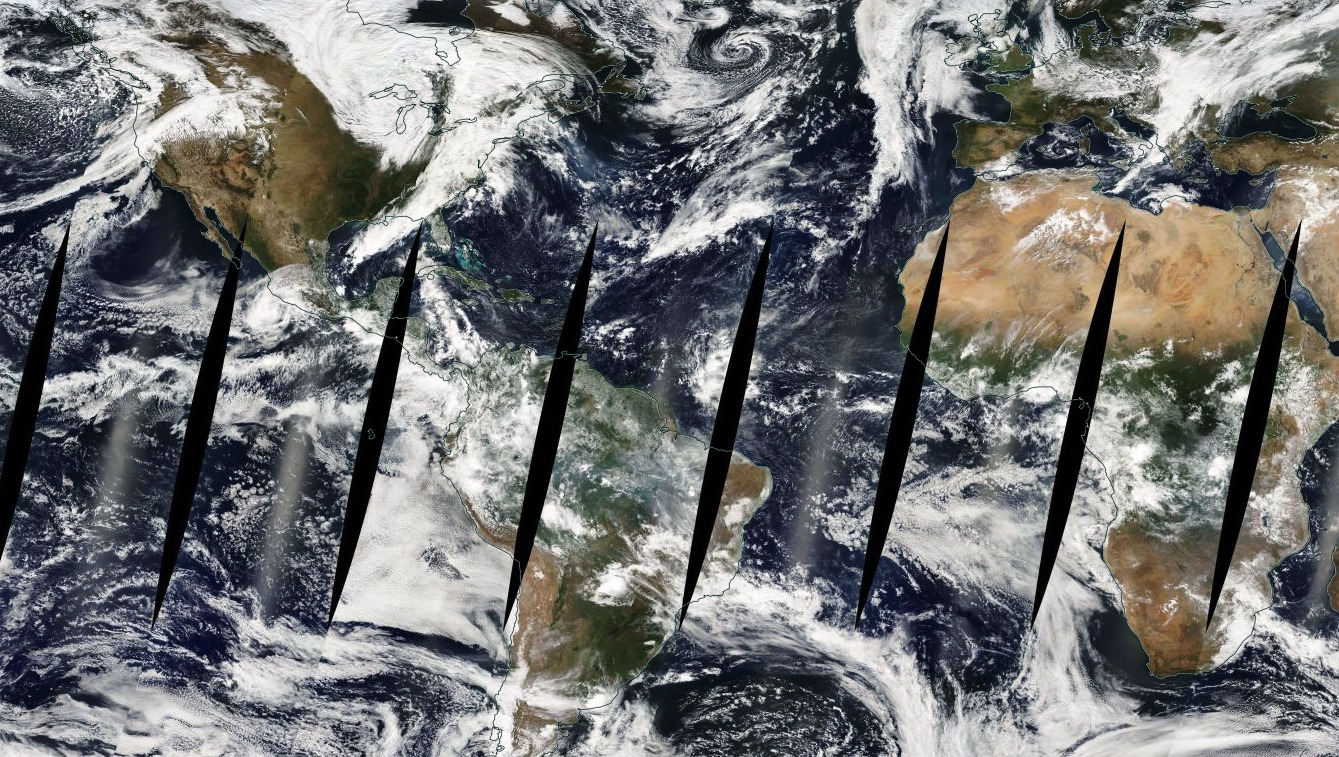
Because of the nature of high-tech orbital hardware, some days have chunks of missing data which show up as large black splotches on the map, but they are fairly infrequent and won't spoil your fun.